Tracking Progress in Massachusetts Schools: A Look at Our Data Dashboard
For the past five years, as part of our Condition of Education in the Commonwealth report, we have been tracking progress on 25 state-level indicators of school performance. We thoughtfully selected these indicators, which span the education pipeline, to provide a snapshot of where our education system is and an indication of where it’s going.
This process allows us to spot trends and highlight those that need attention while holding up examples of success that can be used as examples of success. We hope our data dashboard can act as a tripwire, alerting education leaders to problems that could otherwise fall through the cracks.
While we get our data from the Massachusetts Departments of Early Education and Care, Elementary and Secondary Education, and Higher Education, among other sources, our dashboard is the only place that all these data points are compiled in one spot.
We put all this information on an interactive, user-friendly platform to provide easy access to data that covers everything from early education through college and career success. The dashboard tracks progress over time and highlights disparities in student outcomes based on several factors including income and race.
Over the past five years we’ve noticed substantial improvements in a number of the indicators we track.
- Approximately two-thirds of children aged 0-5 eligible for a subsidy are enrolled in high-quality early education programs, continuing an upward trend.
- An overwhelming majority of students who attend kindergarten do so for the full day due to significant increases in the availability of full-day kindergarten programming across districts; this indicator has increased by 8% over the last four years.
- The number of students with Individual Education Plans (IEPs) spending 80% or more of their day in inclusive settings has increased by 5% in five years.
- Fewer teacher license waivers are being issued for special education positions, indicating an increase in the number of licensed special educators in the Commonwealth’s classrooms—there has been a 10% decrease in these waivers issued for special education positions, from 70% in 2013 to 59.5% in 2016.
- There has been a 9% increase in the completion of MassCore, or the recommended course of study for career and college preparation (68.4% in 2012 to 77.4% in 2016)
- There has been an 8% decrease in students enrolled in developmental/remedial courses in college (36% in 2012 to 28% in 2016).
The path to sustainable improvement has become a key focus of our work at the Rennie Center. This year, our Condition of Education Action Guide will delve into the key factors that lead to meaningful change and provide a blueprint that districts can use to make lasting improvements.
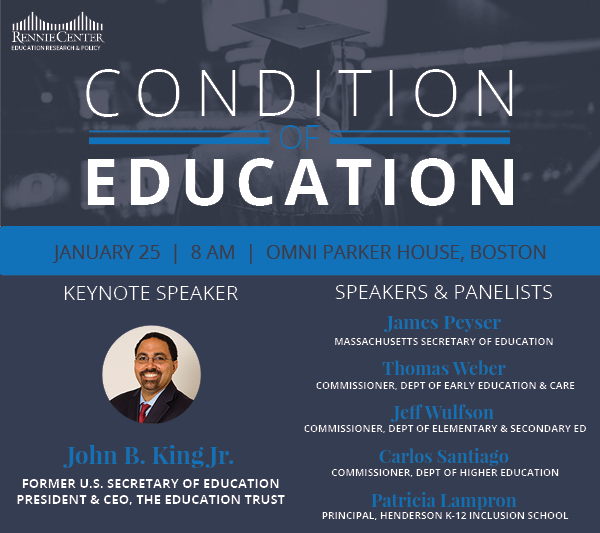
Join us on Thursday at the Omni Parker House Hotel in Boston for the release of this report and a crucial discussion on how our state can improve education for all students.
.